While traffic from AI is still small (roughly 0.1% of all referrals), it’s growing nearly 10× year-over-year. In fact, one study noted a 1,300% surge in AI-driven referrals to retail sites during the 2024 holiday season. Marketers at small and mid-sized businesses can’t afford to ignore this emerging channel. This guide will show you how to identify and track AI-referred traffic using Google Analytics 4 (GA4), visualise trends in Looker Studio, and monitor brand signals via Ahrefs and Semrush – all in plain, practical terms.
Identifying AI Referral Traffic in GA4
To identify AI referral traffic in Google Analytics 4 (GA4), you can use either an Exploration report for a quick, one-off analysis or a Custom Channel Group for ongoing, integrated reporting. The key to both methods is using a regular expression (regex) to match the known domains of AI platforms.
Method 1. Using an Exploration Report
This method is ideal for a quick analysis without altering your main GA4 reports.
- Navigate to Explore from the left-hand menu and create a Blank exploration.
- In the Variables column, add the dimensions Session source.
- Add the metric Sessions.
- In the Tab settings column, add the components to build your report.
- Drag Session source into the Rows section.
- Drag Sessions into the Values section.
- Under Filters, add a new filter for Session source.
- Set the condition to matches regex.
Enter a regex pattern with the domains of known AI tools. A good starting point is:.(chatgpt|openai|perplexity|gemini|copilot|claude|meta.ai|writesonic|you.com|andisearch|komo|waldo).ai|.(chatgpt|openai).com|.(gemini|bard).google.com|.copilot.microsoft.com - Click Apply. Your report will now display only the traffic from these AI sources.
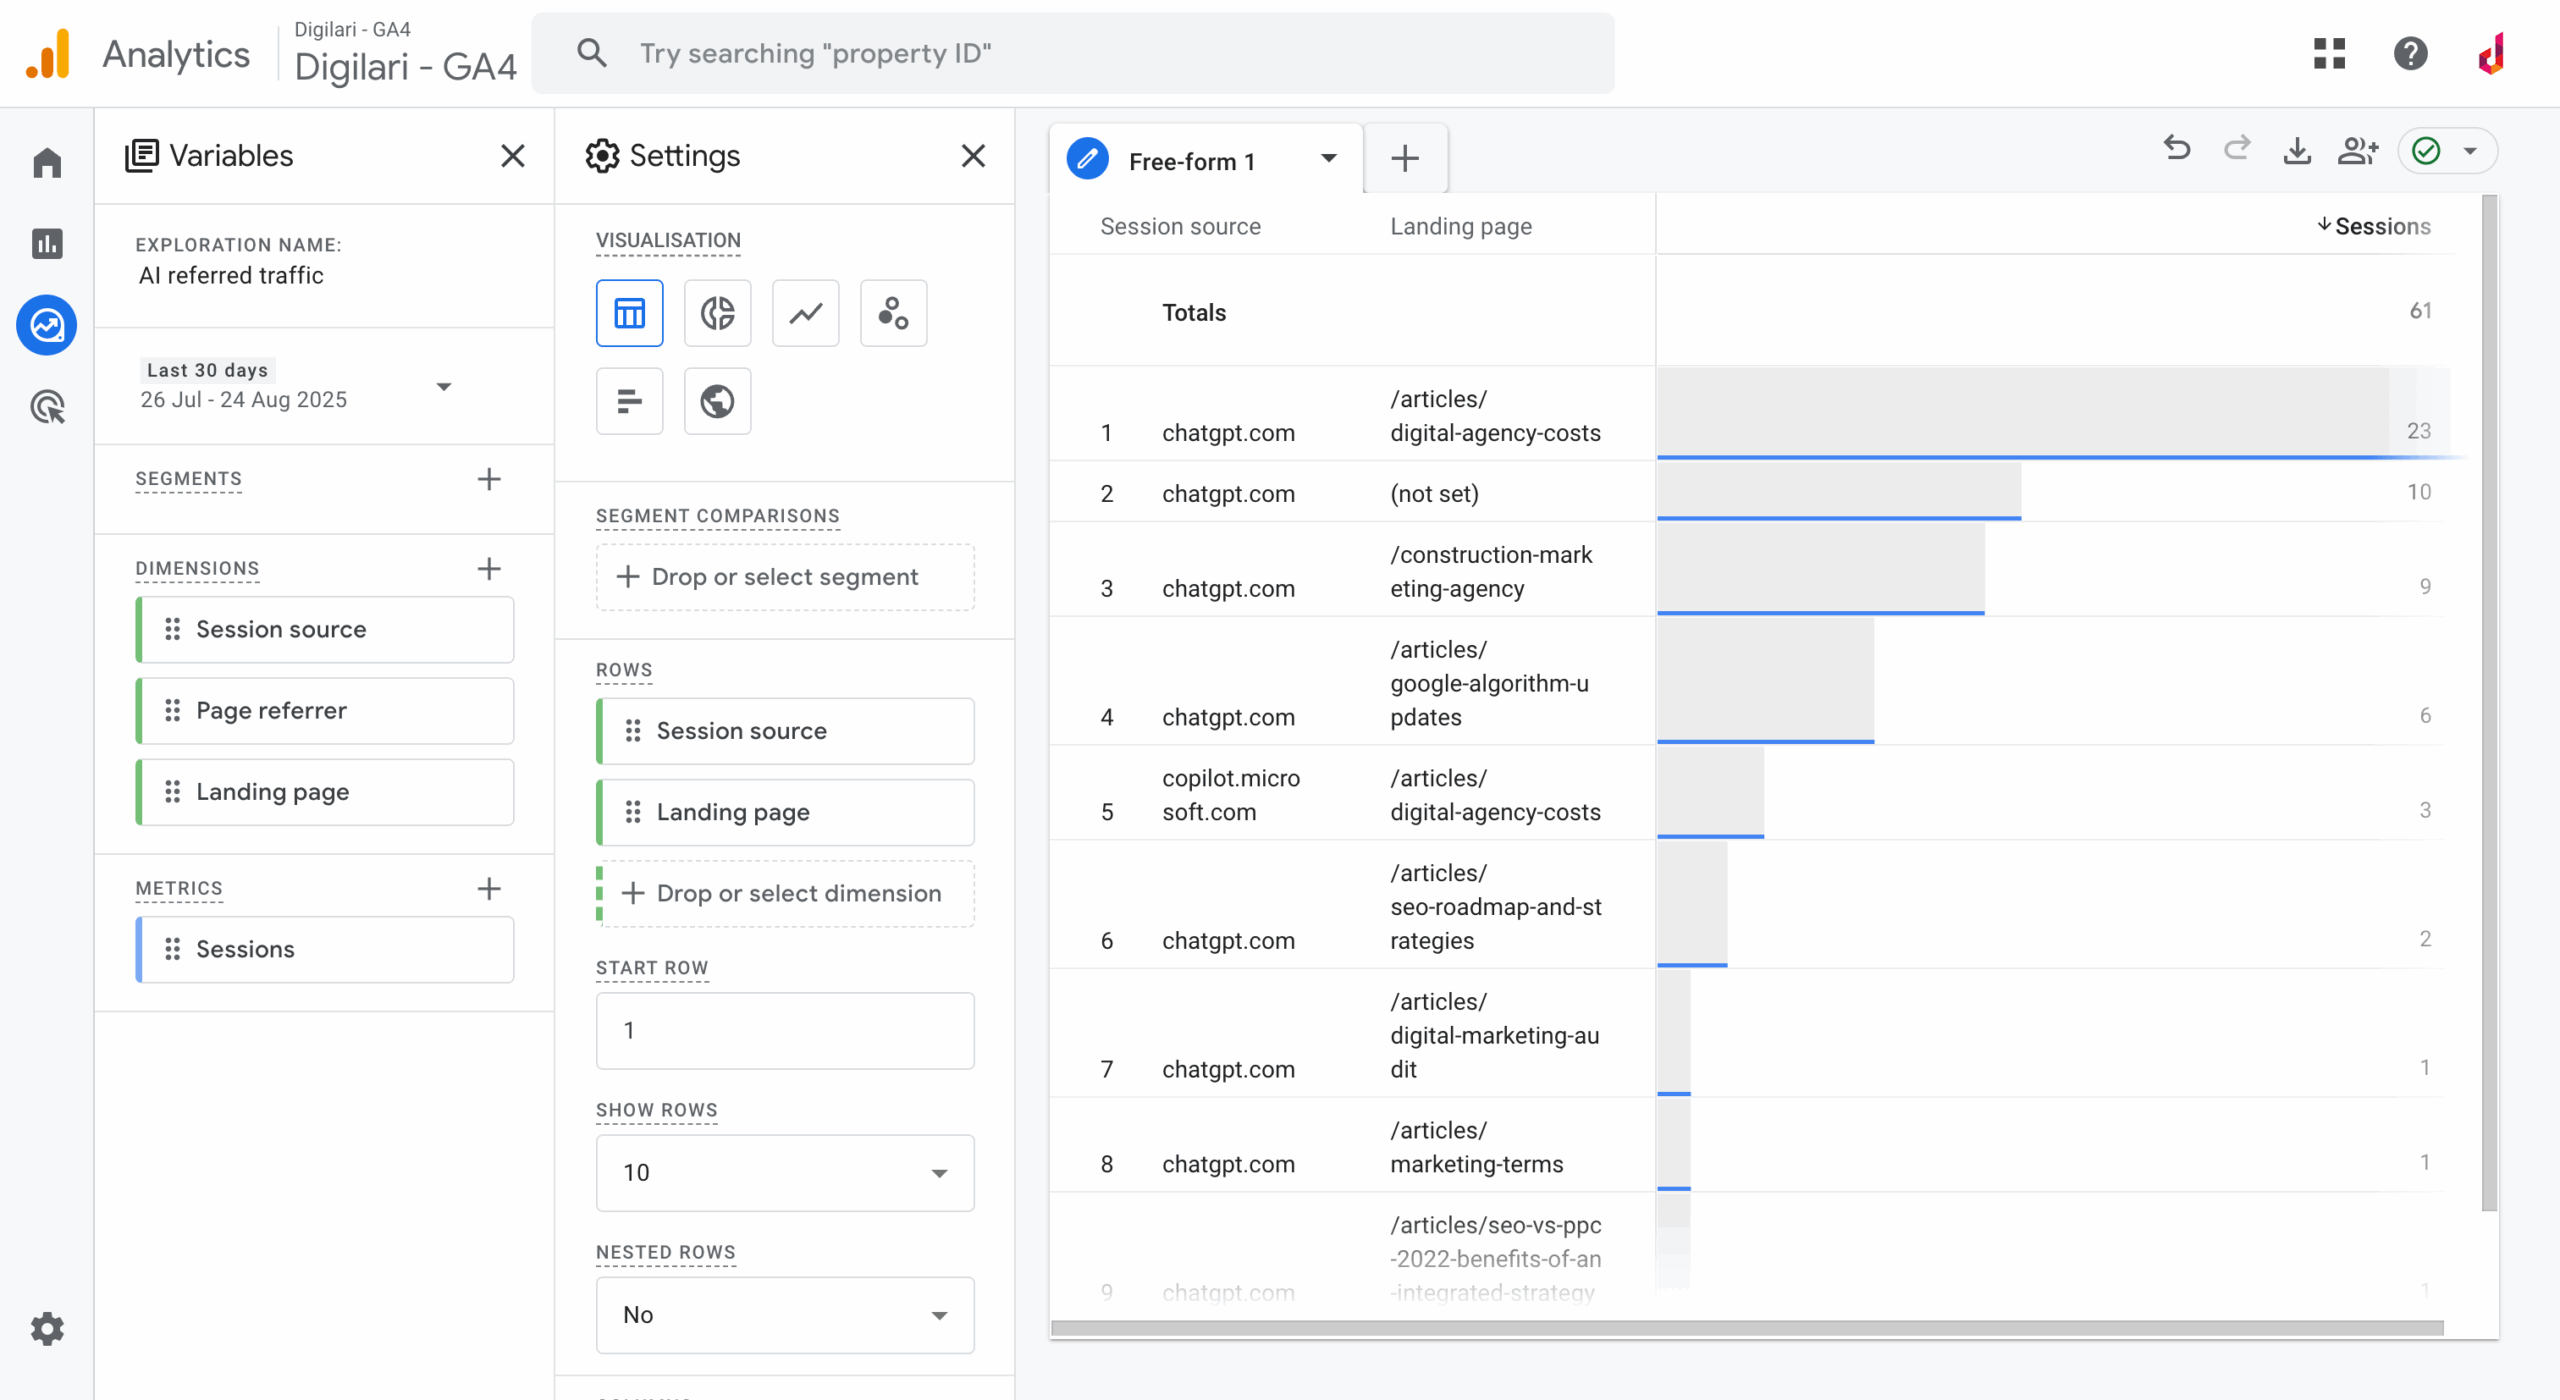
Optional: Add a secondary dimension for landing page: To see which pages these AI visitors land on, add Landing page as a secondary dimension (click Add Dimension on the table). This shows what content on your site is being recommended by AI tools. For instance, you might find that ChatGPT users mostly click through to a specific blog post or a landing page with niche intents.
Once you’ve identified AI sources, you can create custom views in GA4 to monitor them more closely. GA4 offers flexible tools like Explorations and custom channel groups to isolate this traffic for analysis. Here’s how to build useful AI traffic reports:
Method 2: Create a Custom Channel Group (Recommended for ongoing reporting)
This method is the most effective for long-term monitoring as it automatically categorises AI traffic in your standard reports and applies to historical data.
- Access Admin Settings: In your GA4 account, go to the Admin panel (the gear icon in the bottom-left corner).
- Navigate to Channel Groups: In the “Property” column, find Data Display and then click on Channel Groups.
- Create a New Channel Group: Click on “Create new channel group.” Give it a descriptive name, like “AI Traffic Channels.”
- Add a New Channel: Click Add new channel. Name this channel “AI Traffic.”
- Set the Condition: Set the condition to Source or Session source. Choose the operator matches regex. Enter a regex pattern that includes the domains of various AI platforms. A common pattern looks like this: Code snippet
.*(chatgpt\.com|perplexity\.ai|gemini\.google\.com|copilot\.microsoft\.com|openai\.com|writesonic\.com|copy\.ai|claude\.ai|meta\.ai|you\.com|andisearch\.com|komo\.ai|waldo\.fyi).*This regex uses the pipe | character as an “OR” operator to match any of the listed domains. - Prioritise the Channel: Once you’ve created and saved the new channel, use the Reorder button to move the “AI Traffic” channel above the “Referral” channel. This ensures that any traffic from an AI platform is categorised as “AI Traffic” before it’s assigned to the broader “Referral” channel.
- Save the Group: Click “Save Group” to finalise your custom channel.
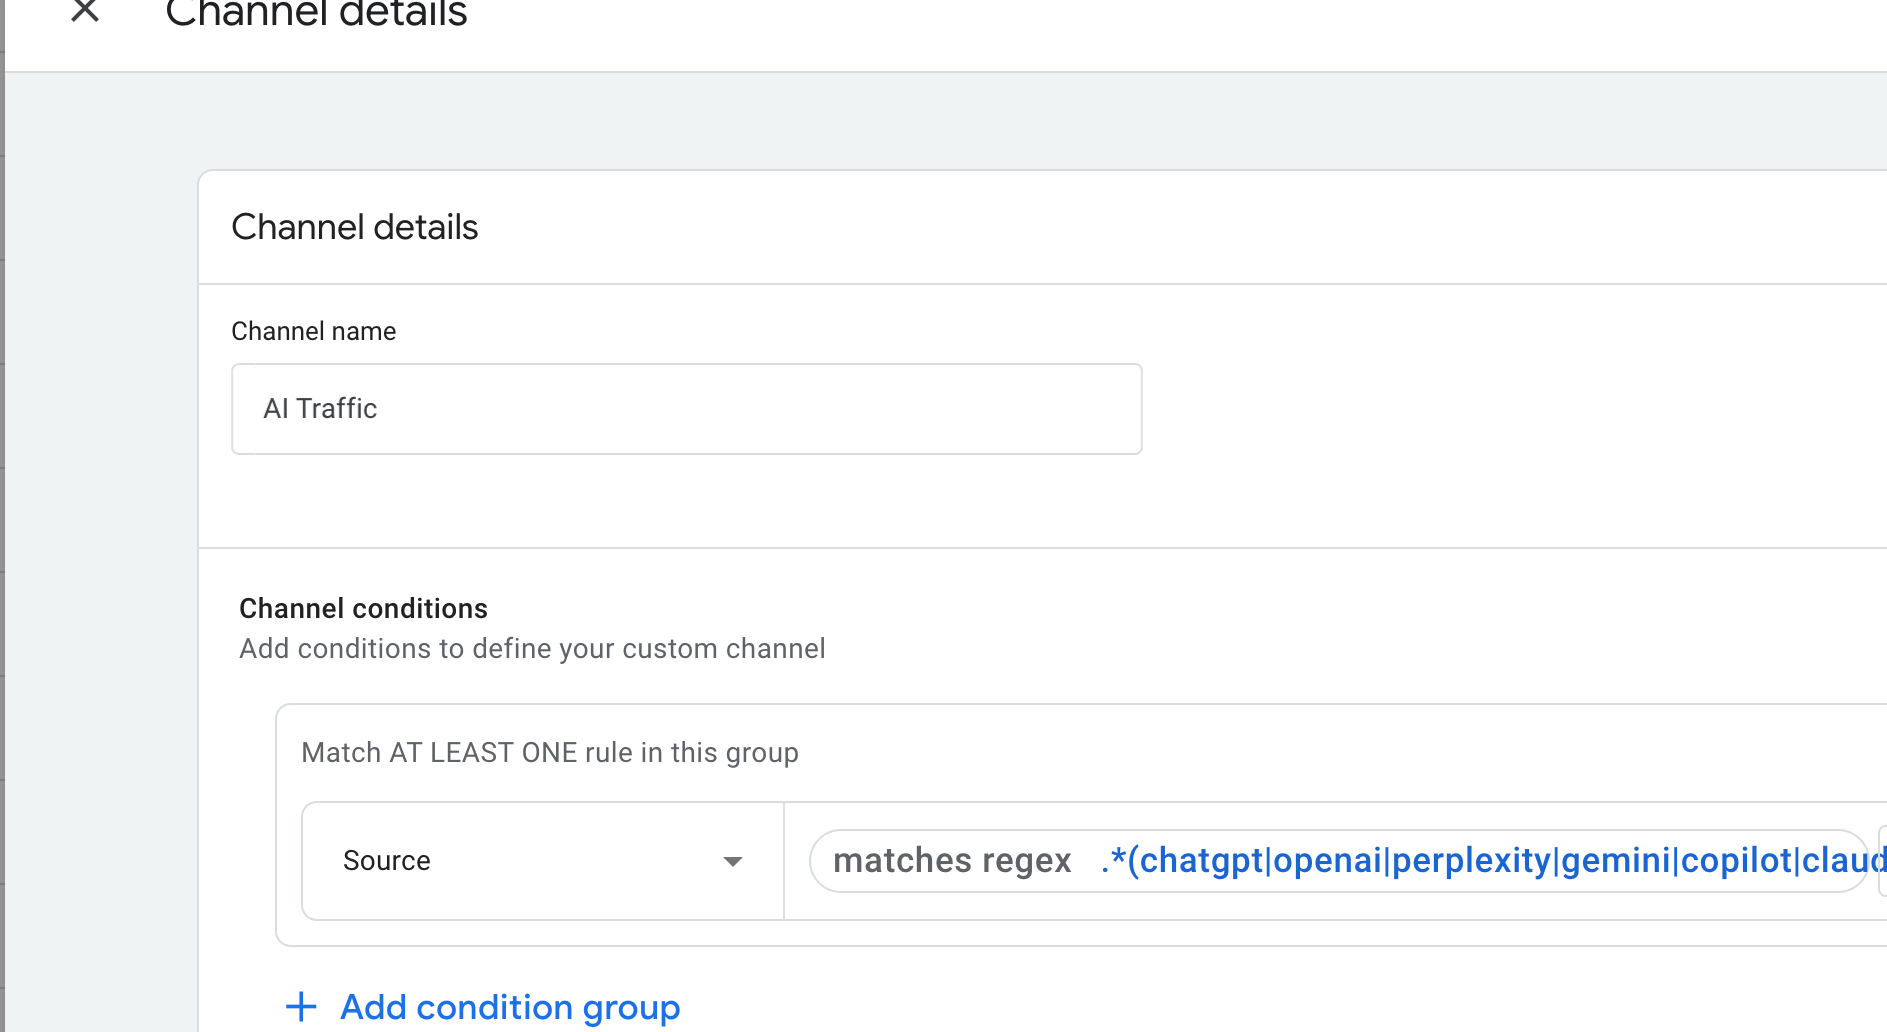
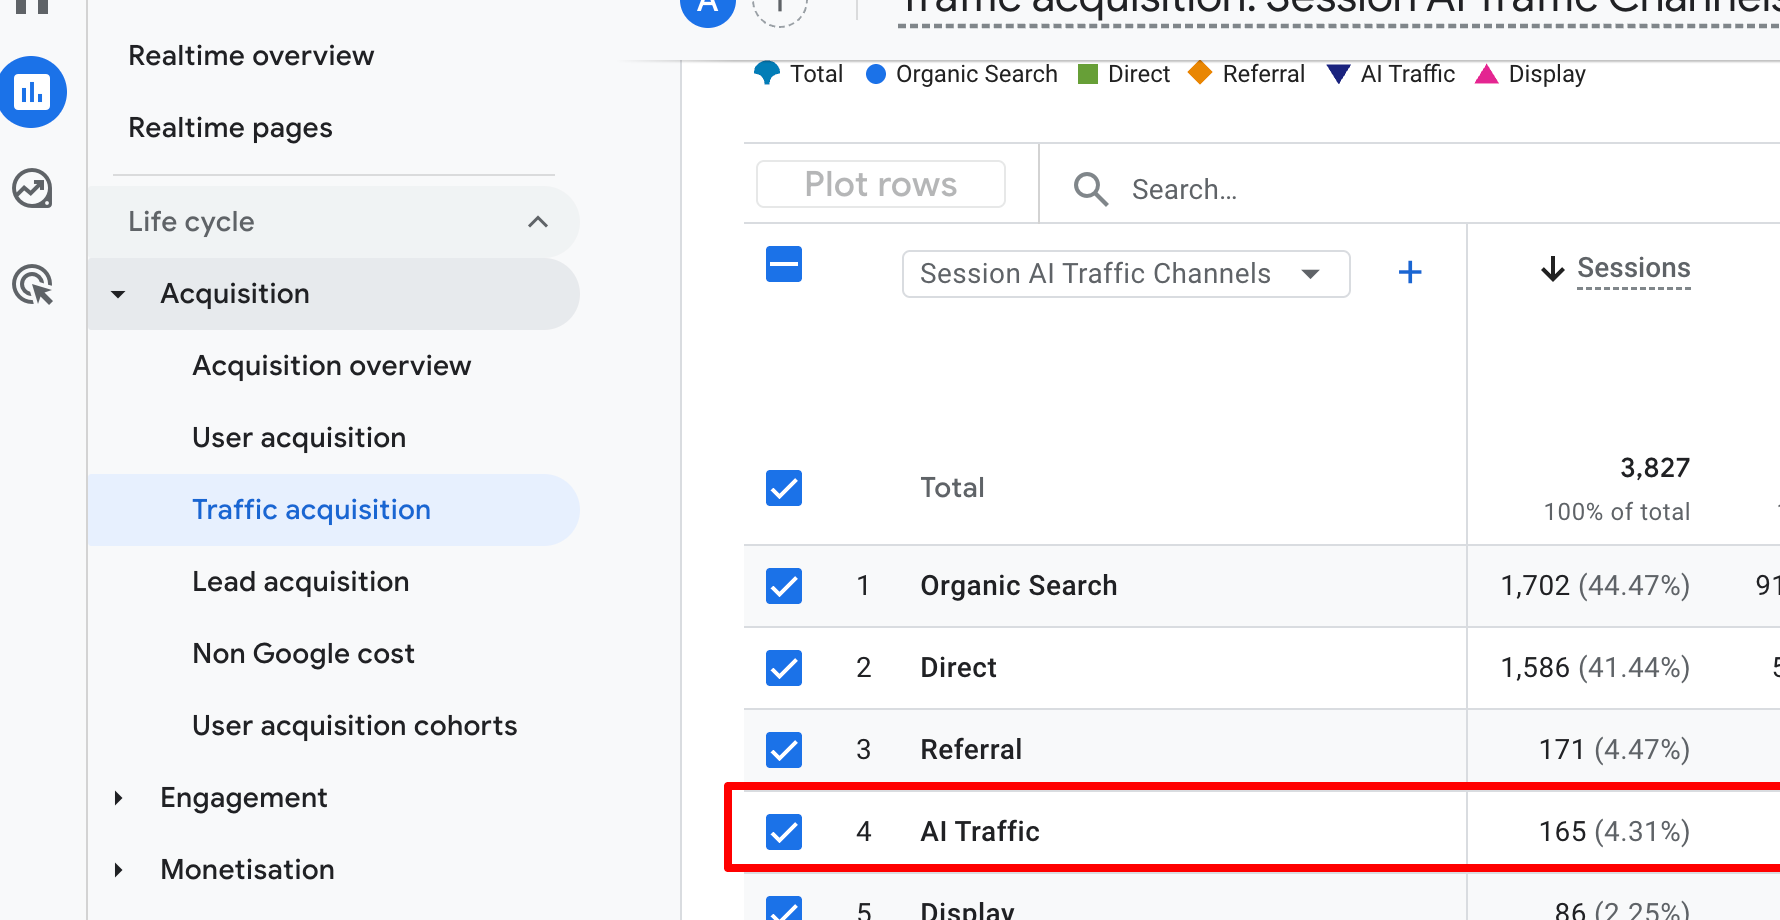
After saving, this new channel group will be available in your acquisition reports. Go to Reports > Acquisition > Traffic Acquisition, and change the primary dimension to your new custom channel group to see the AI traffic segmented out.
Method 3: Use Filters to Identify AI Referral Traffic in GA4 (For one-off analysis)
Google Analytics 4 can capture visits from AI platforms, but these visits often get lumped into generic buckets like “Referral” or even “Direct/Other.” To spot them, you need to dig into the traffic sources. Follow these steps to find which AI tools are sending people to your site:
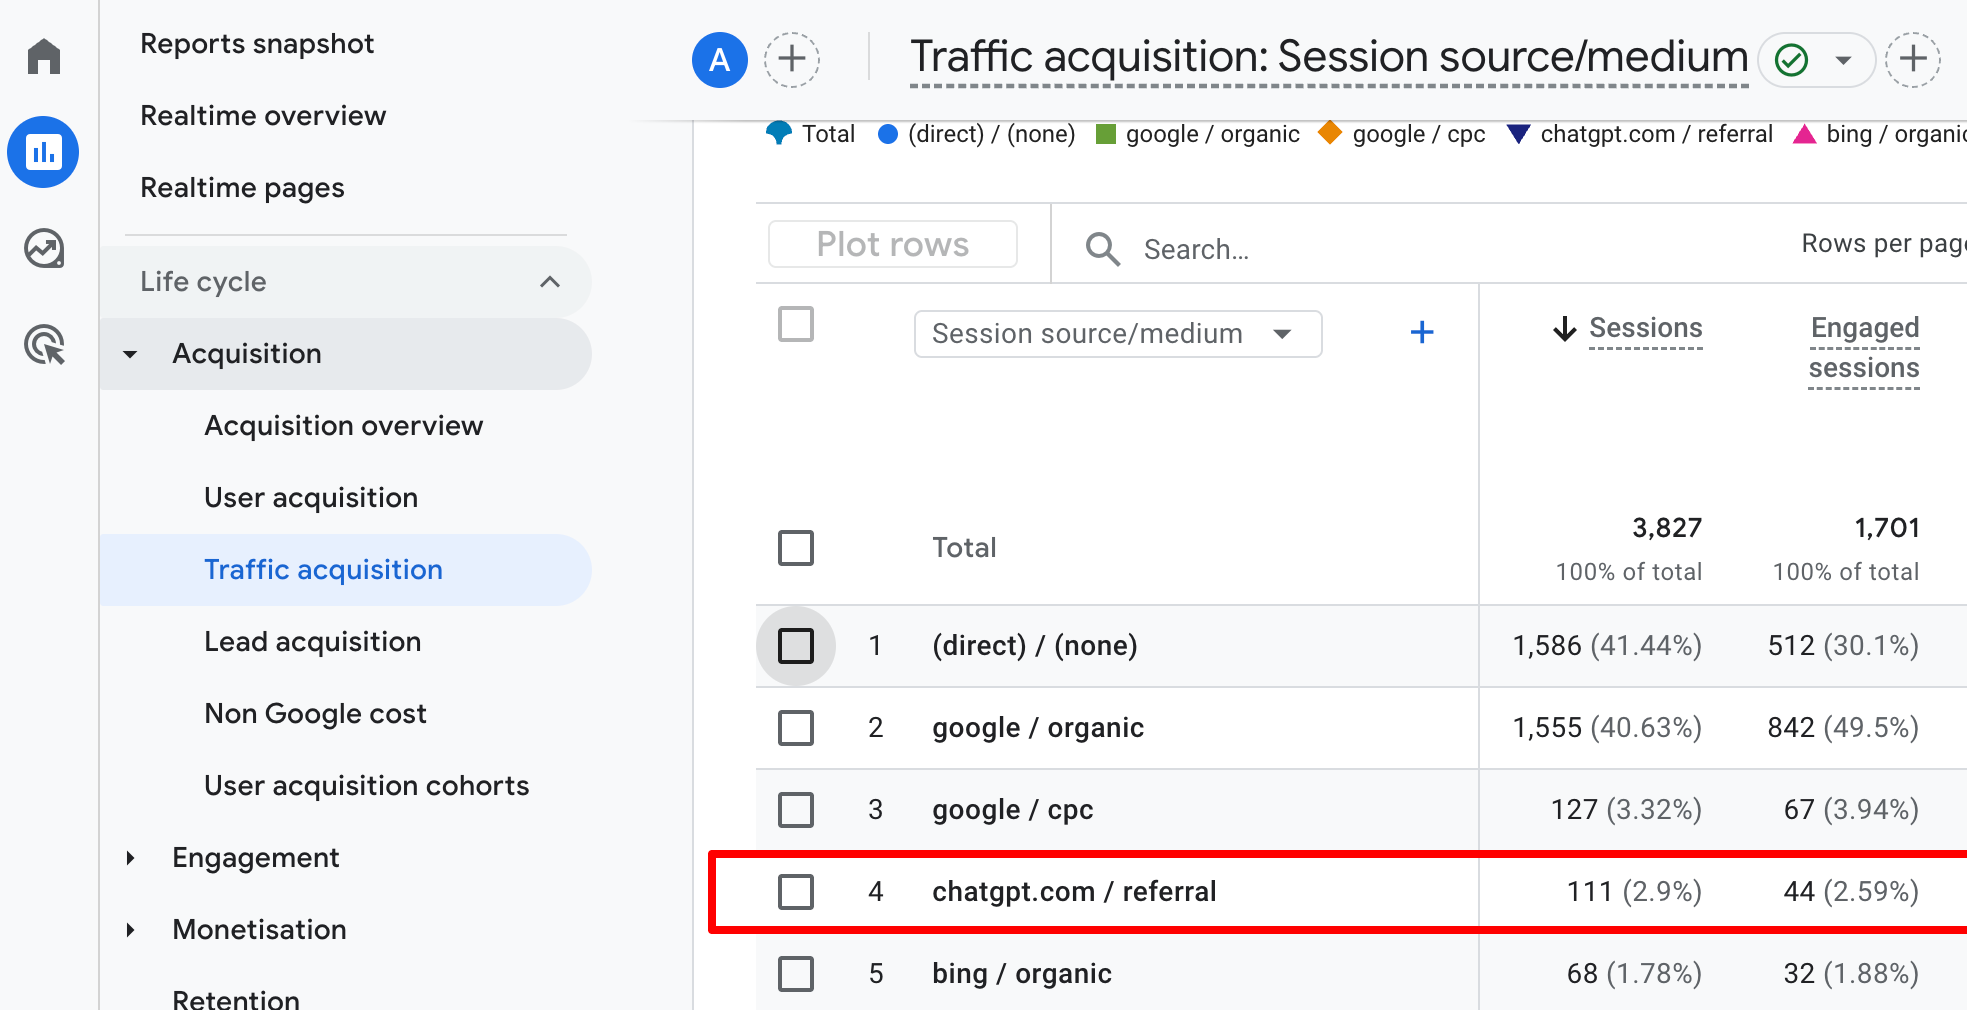
- Open the Traffic Acquisition report in GA4: In GA4’s left-hand menu, go to Reports › Acquisition › Traffic Acquisition. This report shows sessions by channel and source.
- Switch the primary dimension to “Session Source/Medium”: At the top of the table, use the dropdown to change the primary dimension to Session source / medium (or just Session source for a simpler view). This will list the exact domains sending you traffic, along with how they’re categorised (e.g.
referral,organic). - Look for known AI domains: Scan the source list for entries that correspond to AI platforms. Common examples include:
chat.openai.com(ChatGPT)perplexity.aiclaude.aibard.google.comorgemini.google.comyou.com- Any emerging AI tools sending traffic.
Visualising AI Referrals and Branded Search in Looker Studio
This guide will walk you through the process of connecting your Google Analytics 4 (GA4) data to Looker Studio and creating a chart that visualises AI-driven referral traffic.
Step 1: Connect Your GA4 Data
First, you need to ensure your Looker Studio report is connected to your GA4 property.
- Open an existing Looker Studio report or create a new one.
- If it’s a new report, select Google Analytics as your connector.
- Choose your Google Analytics 4 property from the list and click Connect.
- Once connected, your GA4 fields will be available in the data panel.
Step 2: Create a Custom “AI Referrals” Field
This is the most crucial step. You will create a calculated field that uses a CASE statement to group all AI referral sources into a single category.
- In the data panel on the right, click Add a field (the blue
+icon). - Name the field something descriptive, like
Source Category. - In the formula editor, paste the following
CASEstatement. This will check if theSession sourcematches any of the common AI referral domains.
CASE
  WHEN REGEXP_MATCH(Session source, ".*(chatgpt|openai|perplexity|gemini|copilot|claude|meta\\.ai|writesonic|you\\.com|andisearch|komo|waldo)\\.ai|.*(chatgpt|openai)\\.com|.*(gemini|bard)\\.google\\.com|.*copilot\\.microsoft\\.com") THEN "AI Referrals"
  ELSE "Other"
ENDREGEXP_MATCHchecks if theSession sourcecontains any of the specified keywords.- If it finds a match, the value for that session will be
AI Referrals. - If there is no match, the value will be
Other.
Click Save and then Done. The new field will now appear in your list of available fields.
Step 3: Build the Chart
Now, you can use your new field to build a chart. A pie chart is a great choice to show the proportion of AI referrals versus all other traffic.
- In the Looker Studio menu, click Add a chart.
- Select the Pie chart visualisation.
- Drag the new chart onto your canvas.
Step 4: Configure the Chart
Next, you will set the dimensions and metrics for your new chart.
- Make sure the chart is selected so you can see its configuration panel on the right.
- In the Setup tab, find the Dimension section and drag your new
Source Categoryfield into it. - In the Metric section, drag
Sessionsinto it. - Optionally, you can add a Date range dimension to control the timeframe of the data shown.
Step 5: Final Touches
You’ve built the core of the chart! Now you can customise its appearance and add a title.
- In the chart configuration panel, switch to the Style tab.
- You can adjust colors, add a title, and customise the legend to your liking.
- To allow users to filter the report by date, click Add a control from the menu and select a Date range control.
You have now created a dynamic chart that automatically categorises and visualises your AI referral traffic, which will update as new data comes in.
How to Review LLM Traffic on Ahrefs
As AI platforms like ChatGPT and Perplexity begin influencing search behaviour, measuring their impact on your site is becoming crucial. Ahrefs is one of the first SEO platforms to provide visibility into LLM referral traffic, allowing you to compare how much traffic is arriving from traditional search engines versus AI tools.
Step 1: Access Ahrefs Web Analytics
Log in to your Ahrefs account and navigate to Web Analytics. This dashboard now segments referral traffic by source—including Google Search and ChatGPT.
Step 2: Compare Referral Shares
You’ll see Google’s dominance in driving traffic, but also a dedicated metric for ChatGPT referrals. While ChatGPT typically drives a smaller share (less than 1% today), its growth rate is noteworthy. Ahrefs highlights that ChatGPT referrals are rising faster than traditional Google traffic.
Step 3: Analyse Landing Pages
Click into the ChatGPT referral source to view which landing pages are most frequently cited or clicked through from ChatGPT. This helps you understand which content resonates with AI-powered answers and provides opportunities to optimise for generative engines.
Step 4: Track Growth Trends
Monitor month-over-month changes in the referral share from ChatGPT. Even small increases indicate that your brand is gaining visibility within AI-generated responses.
Review AI Citations in Site Explorer
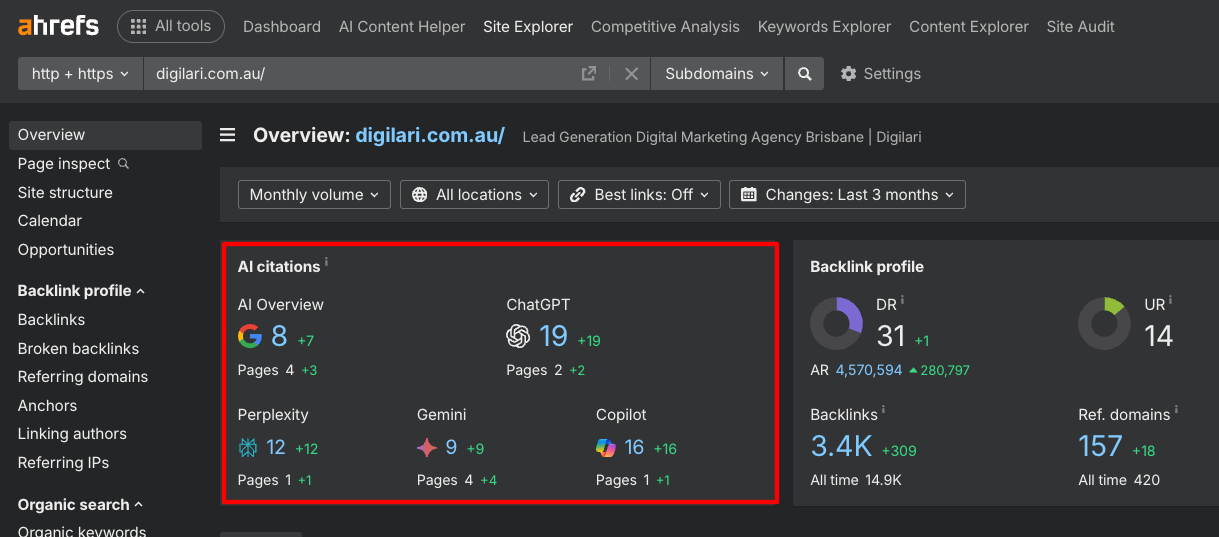
Ahrefs’ AI Citations feature (at the top of the Site Explorer Overview report) tracks when your content is referenced in AI-generated responses. Powered by Brand Radar, it measures clickable links—not just mentions—within ChatGPT, Gemini, and Google AI Overviews.
You’ll see:
- Total AI citations
- Unique pages cited from your site
This lets you identify which pieces of content AI tools find authoritative enough to reference.

